Facebook Blogging

Edward Hugh has a lively and enjoyable Facebook community where he publishes frequent breaking news economics links and short updates. If you would like to receive these updates on a regular basis and join the debate please invite Edward as a friend by clicking the Facebook link at the top of the right sidebar.

Thursday, August 30, 2007

Employment and Unemployment in Hungary

Well the latest set of employment data are out from the Hungarian Statistical Office. The real question is what to make of them. As I keep saying there are things about Hungary that puzzle me, and that I don't yet properly understand. It seems so different in important and significant ways from the other members of the EU 10.

For what it is worth, Hungary's rate of unemployment is now running at 7.0% year on year. This is the figure of the May-July period, but it remains unchanged from the previous three-month period, according to the latest report from the Central Statistics Office (PDF).

Now this in itself is strange. Hungarian economic activity is dropping steadily, we may well be going into a recession, yet the unemployment rate hardly seems to be moving. The 7.0% jobless rate (a figure which is even down from the 7.3% March-May rate), is in fact the lowest rate to be achieved since the end of 2004. The following graph shows the evolution of Hungarian unemployment


The KSH state that the number of unemployed in the May - July period was 296,700 and the number of employed 3.949 million. This latter number is a slight drop from the 3.943 m registered in April-June. At the same time the number of unemployed dropped by 5,800 from the previous 3-m period and remained largely unchanged year on year with the same period in 2006. The jobless rate for the 15-24 year old group, which represents 17.8% of all unemployed, was 16.8%, and this was down 1.7 percentage points from the same period last year.

So what is happening here? Well basically Hungary is getting older, and the working age population is starting to fall, that's what seems to be happening. First off here is a graph which shows the actual numbers of unemployed people in Hungary since the start of 2006.


Now lets take a look at the 15 - 64 age group, over the same period. As we can see, in general terms it is dropping steadily.


The employed population in this age group is fluctuating. It seems to have touched bottom in January/February 2007, and to be now increasing again. Given that the economy is slowing considerably while this employment expansion is taking place, one prima facie conclusion would be that productivity is not rising, and may well be slowing, since with more people working and more productivity the economy should accelerate, not slow. Of course one other possibility is that the average number of hours worked per capita is reducing - no overtime etc - and this is a possibility I will try and explore.


When it comes to the age composition of the labour force we can also notice something interesting. Obviously the majority of the workforce are - at this point in time - in the productive age groups between 25 and 55. But it is also interesting to look at participation rates in the groups outside this age bracket, to see what is happening, and what the future has in stor. Below I have made a chart showing the numbers of people in the 65-74, 60-64 and 15-24 age groups. Now what is clear is that these two latter groups are expanding - this is what an ageing workforce means - while the latter, youngest group, is contracting.

This contraction in the 15 to 24 age group can be for a number of reasons. In the first place it is simply a reflection of the fact that there are progressively less and less people in this age group, as can be seen in the next graph.


But even of those who there are in this age group, given that Hungary wants to become a more modern, productive, economy, it is only to be expected that a growing percentage will seek to achieve a higher level of education and training, and this again is reflected in the graph below which show the participation rates for the three groups we are looking at.


So what is apparent is that while the participation rate for the 15 - 24 group has been falling, the rate for the older groups has been rising steadily. This is only to be expected, since raising the participation rates of the the older groups is one of the only ways (outside immigration) that Hungary is going to be able to find extra labour force in the future, plus of course with the fiscal reductions there will be less available in the way of retirement pensions, so it will become normal that people have to work longer.

So is all, in this case well, that ends well. Well not really, since there is productivity to think about here. It is not my intention to be ageist, but a person in the 65-74 group is not productively equivalent to a person in the 40 to 50 group, and this is the swap that countries like Hungary will soon be making.

In conclusion I would like to mention the fact that Hungary might have something to learn from the case of Japan. In order to try and explain what I am getting at, here's a convenient graph of Japanese economic growth 1955 to 2003 prepared by US economist Michael Smitka from Japanese data available here.
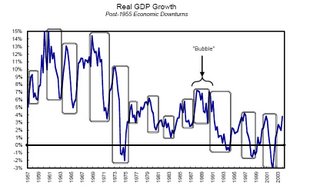


What is obvious from looking at this growth profile is that Japanese growth has been far from uniform over the last 50 years or so. This really shouldn't be so surprising when we think about economic theory a little. Key components of economic growth are the proportions of the total population working, and the kinds of activities they are engaged in. Now if we look at the early part of the graph we can see very high growth rates (which we can also find in eg China, and some parts of Eastern Europe - not Hungary unfortunately - right now). This is know as "catch up" growth, and is due in one part to an ever greater part of the total population becoming involved in economically productive activity, and in the other to a technological (productivity driven) 'catching up' process. As developing countries tend to start at some distance from the existing technological frontier then growth can be proportionately more rapid as they close the distance (again this process can be seen now across the Eastern European EU accession economies).

However - and this is the important point for us here - with time this growth spurt eventually slows, although the loss is to some extent offset as societies generally move up the median age brackets (in the standard cases from median ages of around 30 to median ages in the 35 to 40 category, but this is exactly where Eastern Europe is so very different from the standard case) and by a growing importance of what have come to be known as 'prime age workers' (ie workers in the 35 to 50 age category, just where Hungary is now). A reflection of this prime age wage/productivity effect can be seen in the chart below which shows how the age related earnings structure has altered in Japan over the years between 1970 and 1997.
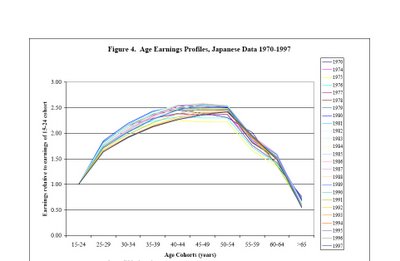


The most important point to note is that wages generally peak somewhere in the 50-54 age range (even though, as a result of the accelerated ageing process which has taken place there many workers in Japan now continue to work up to the age of 75and beyond). The point here is that this individual wage profile may be considered to be some sort of kind of proxy representation for what actually happens to productivity performance of an entire population as it ages. One very revealing detail is that while the shape of the hump has changed somewhat over the years there has been little noticeable drift to the right, which should give some indication of the extent of the age-related productivity problem. Indeed in Japan, as more and more workers have come to belong to the older age groups, aggregate wages at first stagnated, and have now begun to trend down.

OK, this was just an initial exploration. There is no conclusion. Now we need to follow what happens and see how all this works out over time. There are a lot of theories about ageing knocking about all over the place. Now we are going to get to see what the reality actually is.

Wednesday, August 29, 2007

German Consumer Confidence August 2007

Consumer confidence in Europe's largest economy, Germany,dropped for the first time in six months at the end of August, according to Gfk's confidence index for September, which is based on a survey of about 2,000 people. The consumer climate index projected for September fell to 7.6 from 8.5 in August.

The economic outlook sub-index also fell to 48.4 from 64.8, while the income expectations sub-index dropped to 9.2 from 27.9. There was also a decline registered in households' willingness to spend, with that sub-index dropping to 6.4 from 9. To get some idea of where we are, here is the complete index for the last 12 months. As we can readily see, during the last three months nothing has been trending upwards, and the economic outlook and income expectations components have been moving notably down.


Now if we look at the individual components we can get a clearer picture. Firstly the consumer climate:


Really this is not so bad as might have been expected, the climate was much worse back in January and February, just after the 3% increase in VAT. Confidence subsequently picked up, but it may well now have turned again.

If we look at the economic outlook sub index, this seems to have peaked back in May-June, and be now trending down in a way which conforms to the picture we have been getting from the GDP data.


The consumer propensity to spend sub index also makes interesting reading. We can see a marked propensity to spend in the last months of 2006, and then a sudden drop at the start of 2007. The VAT rise is evident. What is also evident is that the effect of the VAT rise has not worn off, as many suggested it would. The 3% increase in costs is still there, and remains there, and the impact will continue. Conclusion, increasing consumption taxes is NOT a way to pay for the health and pension costs associated with an ageing society. It is simply counterproductive, as we are now about to see, I fear.


Finally lets take a look at the income expectations sub-index. This is perhaps the most interesting one of all. Now many of you may remember that early this year there was a lot of talk in the press, and over at the ECB, about how German wages and salaries would start to rise as unemployment dropped and the recovery gathered pace. This was one of the reasons behind the "strong vigilance" expression in the ECB statements. Well if you look at the expectations index you will see that from March to June many people in Germany seemed to believe this story, despite the fact that wages have actually been pretty flat. But as we can see, reality is sinking in, and the German wage earner no longer believes the Goldilocks recovery story, which is one of the main reasons I don't either see this trend as a knock-on effect of sub-prime scandals or as simply a short term blip, but rather I think it forms part of the normal course of events we have become so used to in the German economy context.


As I say in this post, perhaps it is about time that people started to adjust their 2007 German GDP forecasts, to take into account the evident underlying reality there.

Tuesday, August 28, 2007

Conference Board Consumer Confidence Index

Well, for what it is worth, here is the latest reading from the Conference Board Consumer Confidence Index:

The Conference Board Consumer Confidence Index, which had surged in July, gave back all of the gain in August. The Index now stands at 105.0 (1985=100), down from 111.9 in July. The Present Situation Index decreased to 130.3 from 138.3 in July. The Expectations Index declined to 88.2 from 94.4.

Says Lynn Franco, Director of The Conference Board Consumer Research Center: "A softening in business conditions and labor market conditions has curbed consumers' confidence this month. In addition, the volatility in financial markets and continued sub-prime housing woes may have played a role in dampening consumers' spirits. But, despite less favorable conditions and in spite of all the recent turmoil, consumers still remain confident. And, current Index levels suggest further economic growth in the months ahead."


S&P/Case Shiller Housing Indexes Q2 2007

Well, as they say, you should always take a quick glance at the charts that lie behind the news. So let's do this with today's AP story on the drop in US house prices. Here's the story as published:
Housing prices: Steepest drop in 20 years

U.S. home prices fell 3.2 percent in the second quarter, the steepest rate of decline since Standard & Poor's began its nationwide housing index in 1987, the group said Tuesday. The decline in home prices around the nation shows no evidence of a market recovery anytime soon. MacroMarkets LLC Chief Economist Robert Shiller said the declining residential real estate market "shows no signs of slowing down." The index tracks the price trends among existing single-family homes across the nation compared with a year earlier .A separate S&P/Case-Shiller index that covers 20 U.S. cities fell 3.5 percent from a year earlier. A 10-city index fell 4.1 percent from a year earlier.


Now what this story unfortunately omits to tell us is that, in fact, the nationwide housing index has only really fallen significantly on one other occasion during this period, and that was between 1990 and 1993. Lets look first at the chart for this period.


As can be seen the index peaked in Q2 1990 and didn't get back up past the peak level till Q2 1994. (Of course this period did coincide with the election of President Clinton, a point which won't be lost of some of the more astute observers). Now if we compare this with an initial glance at the present slowdown, certain things become evident right from the start.


The first of these is that in comparison with the earlier housing correction, this one, on aggregate, is still not that dramatic. This doesn't mean that it won't turn into a much more serious correction, but at the present point the damage is relatively contained. This becomes even more apparent if we look at a rather longer time series.


Here we can see that house prices really have had a very big run up since 2000, and the downside possibilities really would be quite large if the correction were to turn into a price rout, but at this stage, all we can say is that this isn't happening. In this sense the latest data are really not inconsistent with the picture we were getting from the national Association of Realtors data yesterday.

Going back even further in time only makes all of this even clearer.


Finally, and just for good measure here is the Case Shiller Composite Index, which even if it doesn't effectively add anything new to the picture, does at least serve to complete our collection of charts.

IFO Business Confidence Index August 2007

Well the latest edition of the Ifo Index is now out.

It seems German business confidence fell to a 10-month low in August. The Munich-based Ifo research institute's sentiment index, based on responses from 7,000 executives, declined to 105.8 from 106.4 in July. The Ifo decline was led by a drop in the Business Expectations outlook for the coming six months, with the index falling to 100.4 from 101.7. The effect of this was cushioned by a slight gain in the assessment of current conditions index which rose to 111.5 from 111.3. This was the first increase in four months.


Catalonia and the Baltics

Maybe it is because a young friend of mine here in Barcelona has just come back from a holiday in Finland with an Estonian girlfriend, or something similar, but I am pretty sensitive at the moment to the comparisons which are being made between what is happening here in Catalonia and what is happening in Tallinin.

This article in the Baltic Times today about language teaching in Estonian schools (complete text at the end of the post) is typical of what is in my head.

Basically I don't know a great deal about the current language reforms in Estonian schools, but, going by our experience here in Catalonia, intensive teaching in the Estonian language in the schools is vital as a means of integrating the Russian speaking young people into Estonian society and the Estonian labour market.

First off a few facts concerning Catalonia. The population here is 7 million. This breaks down roughly as follows - Catalan speaking families 3 million, Spanish speaking families from the internal migrations of the 1950s and 1960s 3 million, recent - post 2000 immigrants - 1 million. So native Catalan speakers are a minority, yet Catalan is the predominant public language. And Catalonia doesn't even have a state, just regional autonomy, and control over the education system. Sometimes you can do a lot with just a little.

Now all of this becomes very important when you come to think about the economic difficulties facing the Baltic economies at the present time, difficulties which can be summed up in just two words: labour shortages. As a result migration is going to become a very important lifeline for the economic development of these countries, as I explain in the Latvian case in this post here.

Now Catalonia - despite being a historically relatively low fertility area - has been able to grow into one of the richest and economically most dynamic regions of Europe quite simply by leveraging immigration. Just look at the numbers. It is obvious.

What is also important is that Catalonia has developed an immense capacity for assimilating migrants from a whole variety of different cultures, including those coming from its large Spanish neighbour.

And don't imagine it has been any easier for Catalonia to assimilate Spanish speakers than it will be for the Baltics to assimilate Russian speaking ones. Maybe in the Baltic mind Russia is associated with authoritarianism and totalitarianism for Baltic citizens, but remember that after nearly 40 years of Franco dictatorship, Spain was also associated with precisely these images and feelings in the minds of the Catalans. But they have swallowed their bad feelings, and turned the situation around. And this is what the Baltic states must now do. Their very economic survival is at stake. Latvia, Estonia and Lithuania need to become migrant assimilation machines - a la Catalana. This is the only real way forward to guarantee their citizens the standard and quality of life which they have every right to dream of. Sometimes decisions in life aren't easy, but sometimes you need to bite the bullet.


President of EU Parliament visits Narva, praises language reforms


TALLINN - The President of the European Parliament Hans-Gert Poettering gave tacit support to Estonia’s schoolbased language reforms during an official visit from Aug. 14 - 17. Poettering, a German conservative, veered off the normal diplomatic path by visiting the eastern border city of Narva to talk with residents about language concerns. While he acknowledged the often-leveled claims of discrimination against Russian speaking residents, Poettering said wider study of the Estonian language was the only way forward. He praised the government’s school reforms, which will see one extra class delivered in Estonian at Russian-speaking schools from Sept. 1. Poettering said the program was the key to better integration.

“It will then be possible to move on. It is important that the two communities should communicate with each other,” he said, adding that such communication was only possible through the broader study of the Estonian language. He also called for Russia to deal with its own history, and to adopt a better understanding of Estonia’s misery under Soviet rule. “Life under the communist dictatorship has left a very strong mark on Estonians. It is connected with liberty. That understanding, I think, is not very widespread in Russia,” he said. When meeting with Russian community groups and public figures in Narva, Poettering said it appeared most residents of the border city considered themselves Estonian, no matter what language they spoke.

His working visit also included meetings with President Toomas Hendrik Ilves, whom he invited to address the European Parliament, and Prime Minister Andrus Ansip, who demonstrated Estonia’s highly praised e-government cabinet room. Poettering, who comes from a legal background, was elected president of the European Parliament in January this year.

Padoa-Schioppa and the Italian 2007 GDP Growth Forecast

Italian Finance Minister Tommaso Padoa-Schioppa is being quoted in the press this morning as saying that ``The growth target of 2 percent for 2007 appears to be more ambitious that we thought two months ago,''.

He certainly has this one right. With growth in Q1 at just 0.3% and in Q2 at 0.1%, and the eurozone economy visibly slowing by the day, I would say it will be hard this year for Italian GDP to push through the 1% ceiling as an annual total. Basically I don't see combined growth in Q3 and Q4 as being greater than the combined total for Q1 and Q2. I explain some of my reasoning here.

This is why I normally don't agree with the kind of economists Bloomberg seems to consult, who seem to continually regard Italy's consistently sub-par growth readings as "unexpected". If you look at Italy's growth history over the last 15 years, think about the ageing population issue, and follow the short term economic data on consumer confidence, retail sales and industrial ouput, then the GDP readings being obtained shouldn't come as a shock, since they are empirically and theoretically entirely to be expected. As a consequence the annual growth rate for 2007 looks like being well down. To be talking about 2% growth at this stage is frankly ridiculous. As I say, in the current climate it is hard to imagine H2 2007 being better than H1. So I think someone somewhere had better get to work preparing the explanations for those good people from Standard and Poor's and Moody's.

Monday, August 27, 2007

US Midwest Manufacturing Index July 2007

Well, for what it's worth here's this months reading on the Chicago Fed Midwest manufacturing index:


Since January the trend has been steadily up, though midwest manufacturing obviously took a significant knock at the end of last year, as a result the year on year reading is not that substantial. Clearly the line is up though, which to some extent must be a consequence of the relative weakening of the dollar.

As Reuters says:

The Chicago Federal Reserve Bank said on Monday its Midwest manufacturing index rose in July amid broad-based gains in all sectors.The index gained 0.6 percent to a seasonally adjusted 106.0 from an upwardly revised 105.3 in June, originally reported at 104.9. Still, compared with a year earlier, Midwest factory output was only 0.5 percent higher, trailing the 1.9 percent national increase in industrial production. Output in all four of the regional manufacturing sectors tracked by the Chicago Fed rose in July. The biggest gain came in resource output, up 1 percent on strength in food, wood, paper and chemical production.Resource production ran 3.2 percent above a year ago, outpacing the national 1 percent increase, while year-on-year output fell in the auto, steel and machinery segments.Midwest machinery sector output for July rose 0.8 percent from June but was down 0.7 percent from a year earlier.Auto sector production rose 0.3 percent and steel output was up 0.7 percent in July The Chicago Fed Midwest Manufacturing Index is a monthly estimate of manufacturing output in the region by major industries. The survey covers the five states that make up the seventh Federal Reserve district: Illinois, Indiana, Iowa, Michigan and Wisconsin.

Following is a breakdown of the index components:

Percent change:

July June July 07/06 CFMMI +0.6 +0.4 +0.5 Auto +0.3 +0.1 -0.1 Steel +0.7 -0.3 -0.7 Machinery +0.8 +0.2 -0.7 Resources +1.0 +1.2 +3.2

US Economy Reality Check

This is the first of a series of posts which will try to get to grips with the state of the global economy in the wake of the recent liquidity turbulence.

The Story So Far


As indicated in this post, the big danger we face at the present time is that the current liquidity crunch converts itself into a credit crunch. This may or may not happen. For it to happen there needs to be a pretty systematic ongoing process of interaction between the financial markets and the real economy in such a way that the negative components of each of them reinforce each other. As far as the global economy goes, there are a number of key sectors to keep an eye on: the US, China, India, Germany, Japan, Italy and Eastern Europe. Eastern Europe is especially important, not for its magnitude, but for its growth rate, and its significance in the recent expansion of high risk new credit.

Now Germany, Japan and Italy all seem to be slowing considerably at the present time (for Geramny see here, for Japan see here, for Italy see here). China is more or less on course - now a touch this way, now a touch that, as is India. Eastern Europe is starting to overheat badly (and here, and here, and here).

And the US? In many ways the US could tip the balance one way or the other. So watching how things play out in the US in the coming weeks and months can prove to be critical.

One of the issues at the moment is that the financial markets are a bit adrift due to the lack of real data, so what little news there is is rapidly pounced on.

Today we have two pieces of "news" from the US. The UBS investor optimism index, which you can see below.


Obviously the index has been trending down slightly of late, but it is hard to read any deep significance into this, since it has been moving up and down quite vigourously throughout the present business cycle.

The other piece of data we have to say is the existing homes sales index for July from the US National Association of Realtors.


Now clearly the volume of sales has dropped off considerably, about 9%, as compared with a year ago. And this does mean that the rate of turnover in the market is low. But if we look at the prices index (see below) then - at least nationally - the price decline situation is far from dramatic. I would expect to see a lot worse in some of the most vulnerable European economies (Spain, Ireland, Greece) if the liquidity crunch really does turn into a credit crunch. At the present time all we can say is that this outcome represents a possibility, but it is still certainly by no means an inevitable eventuality.

However, as DailyFXnote, this data is now to a certain extent history:

In the US today the markets will get a look at the Existing Home Sales data with consensus call forecasting a small contraction from the month prior. The data is for July and therefore may be a dated in its value as the recent market turmoil has made credit far more difficult and costly to obtain which will likely have a much more depressive effect on home sales as we move into the fall season. The median house price data is expected to fall this year for the first time since federal housing agencies began keeping statistics in 1950 indicating the sharpness of the decline.


Essentially there is anecdotal evidence all over the place that people have started to find it much more difficult to obtain mortgages, even people who are in no way "sub-prime", so it is hard to believe that existing home sales in August won't be well down, which is just one of the reasons why Bernanke may be seriously considering a rate reduction in September, and one of the reasons why Jean Claude Trichet may be having second thoughts, since some Eurozone economies will be very sensitive to any credit conditions tightening. This is going to be a very hard call for them all.


Now this chart needs a bit of explanation, since I have done a bit of simple improvisation. The bars in brown represent average prices for 2004, 2005 and 2006 respectively. I have put them alongside the monthly time series for 2006 and 2007 (the blue bars)just so people can get an idea of the orders of magnitude involved, and of the size of the "correction" - at least to date. Of course, the big outstanding question is whether the slowdown in turnover will eventually translate itself over into a more substantial price reduction. I would say that that is really the big outstanding "what if" question at this point in the US business cycle, and why I think it is possible that things can move one way or another, depending really on the conditions under which US banks are prepared to lend money to first time buyers.

Obviously there is a correction going on, but to date it is hardly a dramatic one. There are still plenty of sales, and prices are not falling dramatically. Clearly there are a lot of delinquencies in a relatively small part of the US market, but does this have to bring the whole global credit industry to a halt? I find that hard to believe.

Obviously people are nervous for a whole variety of reasons, and this nervousness is currently focusing on the US most risky mortgages sector. But these people also represent some sort of version of "moral hazard", since they know that Bernanke will ultimately bail them out, don't they? Isn't that what all the shouting is about. Ouch, it hurts! Please help me.

That all of these cries of pain come from people who supposedly believe in market economies really does make me laugh.

Actually, the whole situation does make me think about how the business cycle is 90% psychological, and about how right Keynes was to talk about animal spirits.

Basically, I think the key market participants are bi-polar, and once they get in a gloomy state then on comes the recession. Obviously there are underlying fundamentals that play a part like this housing correction, but, come on, you could legalise 11 million Latinos tomorrow, and sell them a lot of houses, if this was the only problem. It appears other issues also play their part here. I mean, if they were all legal and regular, a lot of these people would stop being sub-prime, wouldn't they? So why aren't they, and why are some people busily trying to use taxpayers money to build a wall between the US and Latin America? Where is the underlying economic rationale here?